All About Value Analysis

Value analysis is a structured, results-oriented approach that helps teams systematically evaluate products, services, and processes to improve cost-effectiveness without compromising quality or performance. Whether applied in manufacturing, procurement, or operational workflows, value analysis empowers companies to identify unnecessary expenses, streamline operations, and boost both customer satisfaction and profitability.
Exploring Pareto Chart In Quality Control
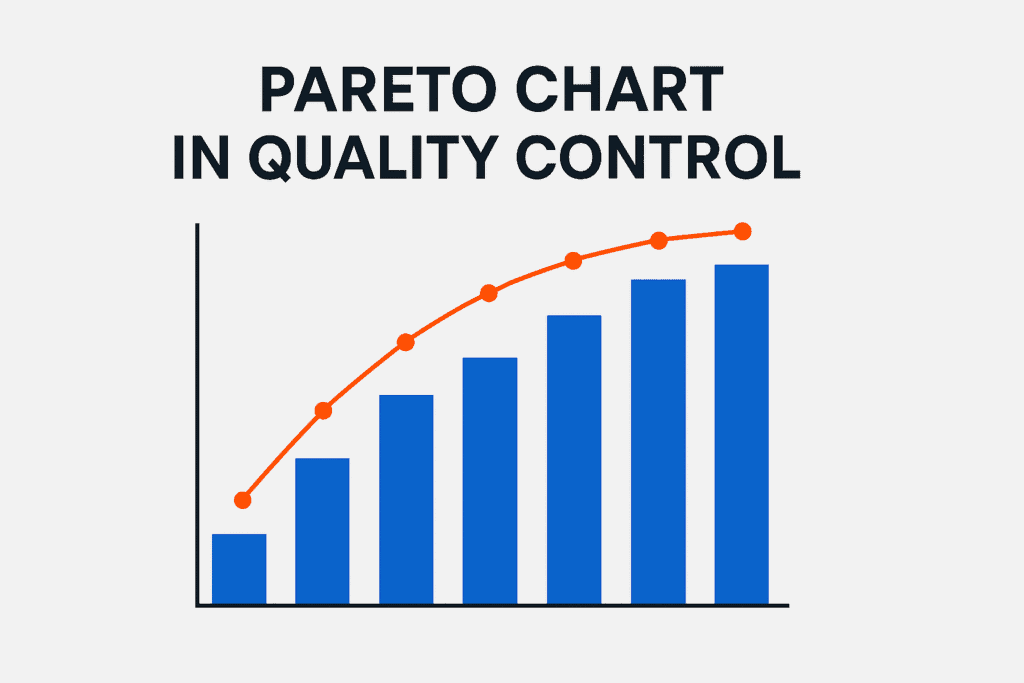
In quality management, identifying the most impactful problems is essential for meaningful improvement. The Pareto chart in quality control serves as a practical tool to pinpoint the few causes responsible for the majority of issues. Based on the 80/20 principle, this chart organizes problems in descending order of frequency or impact, allowing teams to focus on what matters most. Widely used across industries, it brings clarity and structure to decision-making in process optimization, defect reduction, and customer satisfaction efforts.
Why Quality Control Chart Matters

Is using pre-control charts effective for process or just time wasting? Many specialists disagree about pre-control’s definition as a SPC tool. Are important in process setting or not?
Exploring Business Process Improvement

Almost everything we do in life—personal and professional—involves a process. When we do it repeatedly, we have a repeatable process. For example, driving to work every day is a process that—if executed consistently— leads to predictable results: We get to work on time, assuming there are no special causes such as accidents.
Exploring Quality Function Deployment

In the world of business and industry, every organization has customers. Some have only internal customers, some just external customers, and some have both.
The Power of Voice Of The Customer Table

Quality function deployment (QFD) begins with an exploration and discovery of customer needs. A number of tools and approaches exist to help organizations focus their first and best efforts on what matters most to customers and areas where competitors’ offerings may be preferred.
Your Guide to Kano Quality Model

Many “experts” insist that customers don’t really know what they want; they have to be told. They’re wrong, dead wrong! In reality, customers know exactly how they feel about a product or service—even if they can’t always articulate it. That’s where the Kano Model comes in: a powerful tool that helps decode customer expectations, revealing the subtle differences between what delights, what satisfies, and what frustrates.
The Power of Juran Trilogy

Dr. Juran left us with many important fundamental methods and tools during his years as the leading expert in the field of Quality Management.
The Power of The Four Absolutes

Most, if not all, of us recognize that none of us is perfect, but the concept of quality is continuous improvement to make what we do a little bit better every time we do it.