

- Ready a team for the event
- Example of typical three-day VSM kaizen event agenda
- Process family matrix example
- Common value stream mapping icons
- Value stream mapping current state map example
Value stream mapping
For a lean journey, think of Value Stream Mapping as the launch pad to begin identifying and improving a process family. VSM is about sparking change —decluttering the process of the nonessential activities that don’t add value but waste time and resources. VSM, as it is known today, tems from Toyota Motor Co.’s material and information flow diagrams. In its most basic form, VSM shows the process steps from order entry to delivery.
The value stream in VSM is the point at which value is actually added to the product or service by changing the market form or function to meet the customer’s needs. For example, value adding activities can be things like: machining, assembly, welding, drilling, folding, painting and so on. If you are not adding value, you are probably adding muda, the Japanese word for waste.
Ready a team for the event
The best—and probably easiest—way to create a VSM is to form a cross functional team that includes supervisory or managerial level members from throught the organization. Representatives from departments like sales, customer service, scheduling, purchasing, operations, inventory control, maintenance, quality and information technology can be valuable contributors to this part of the VSM journey. Even customers or suppliers— both internal or external—add unique perspectives.
Be aware of the actual size of this team and how it can affect decision making and action. A good team size is usually between seven and 10 members. This size makes it easier for members to conduct interviews and “walk the flow”, that is, actually visiting each of the work areas affected by the process evaluation and included in the VSM to see firsthand how things work or don’t work. Predictably, the larger the team, the more difficult it may be to manage. If the team has fewer than seven members, there may not be enough voices to provide well rounded input. Finally, never create a map with a team of one. You will not get enough valuable input or cross functional dialogue or the results may be biased for one area, person or department.
Kaizen kick-off
Once the team is formed, a three day kaizen event (shown in the table), is usually enough time to create the current state and future state maps, along with the draft plan. More time may be needed to complete the detailed draft plan and determine the resources required to implement the lean ideas. It is important to designate an individual with previous experience in VSM to facilitate this kaizen event.
Typical three-day VSM kaizen event agenda
Day 1
- Introduce VSM
- Determine process families
- Walk the flow and gather information
Day 2
- Draw the current state map
- Perform lean concept training
Day 3
- Create the future state map
- Develop the draft plan
At the kaizen event, the team must complete four important steps to progress through VSM:
- Determine the process family.
- Draw the current state map.
- Determine and draw the future state map.
- Draft a plan to arrive at the future state.
Process family
A process family, also known as a product family, is a group of products or services that go through the same or similar processing steps. To determine your process family, create a matrix. In the first column, write down the parts (for example, components, stock keeping units, finished good items or services) your organization makes or provides. Place an X in the corresponding box if the part goes through the processing step.
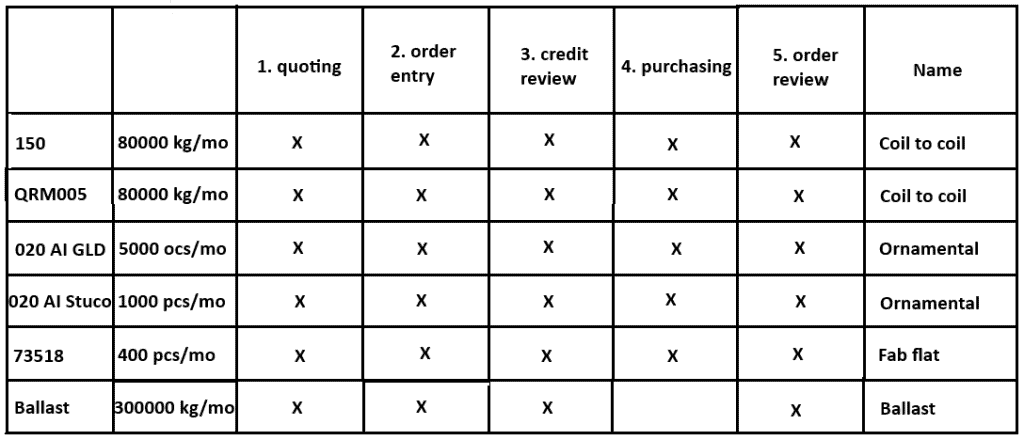
Do not skip this step. Building a process family matrix can save you much time in the future and help avert headaches down the line. Taking this step will help everyone understand the value streams and where they are in the process.
After completing this vital step, examine the matrix and look for parts that go through similar or the exact same processing steps. Search for items or parts that share about 80% of the steps.
Look for items or parts that would make sense if they were created alongside each other in a manufacturing cell. In other words, consider items or parts that share many of the same steps and procedures that can be created together – by the same workers using similar or related steps – more efficient in a manufacturing cell.
At this point, the team must select the particular process family it will concentrate on for the current state map. Every organization may have a different reason for selecting one process family over another when deciding which map to draw first or which order it should map out its value streams. Here are some criteria the VSM team may use to decide which process family to draw:
- Biggest bang for the buck.
- Largest reduction in lead time or inventory.
- Biggest impact to the customer.
- Highest probability for success.
- Most visible to stakeholders.
- New product line.
- Volume or quantity.
Download our e-book
Download our free e-book to discover how GQ Interim can transform your business with expert leadership solutions!
Plotting the current state
The current state map should illustrate how your organization’s processes perform in today’s work environment. To create a current state map, collect the data and information by walking the flow and interviewing the people who perform the task. There are two main reasons why walking the flow is more beneficial to creating the map than staying seated at your desk in front of the computer:
- The team will have the opportunity to see the entire process and look for waste.
- Value-adders – the people who actually perform the work (operators, assemblers, technicians, etc.) – can answer questions and clarify any misconceptions or preconceived notions on how tasks are performed.
From walking the flow, the team can collect on a worksheet several types of information, such as:
- Cycle time or processing time.
- Changeover time.
- Reliability of equipment.
- First pass yield.
- Quantities.
- Number of operators and shifts.
- Hardcopy information.
- Electronic information.
- Inventory levels.
- Queue or waiting times.
There’s a rule of thumb to help the team: If the information is in the ballpark then it can be used to get started. For example, if an operator says her machine breaks down about four hours every week, the team can mark down 90% for reliability (of equipment). If it’s discovered later the actual reliability was 91%, that difference wouldn’t have that much of an impact. Ninety percent was bad enough for the team to know some changes were necessary. You do not have to wait for perfect data (analysis paralysis), but wrong or disinformation needs to be clarified. If you are in doubt about any of the data, then consider measuring it to verify.
Pencil and paper
With the information gathered from walking the flow and the ensuing team discussions, it’s now time to sharpen the pencil and put the lead to paper. Any VSM can be drawn using simple symbols or icons, some of which are shown on a picture.
Key areas on the map are:
- The upper right corner for customer information.
- The upper left corner for supplier information.
- The top half of the paper for information flow.
- The bottom half for material (or product) flow.
- The gutters on top and bottom to calculate value added and nonvalue added time.
Calculate the cycle time vs. the inventory time (in days) for the material and information flow. Every VSM will look slightly different depending on the exact process, the author who drew the map and how it was drawn.

If this is one of your first VSM kaizens, have the experienced facilitator draw the map on a large dry-erase board and the team members draw each of their own maps on paper. If your team members are more experienced, they may gather the data first and then draw the map. If they are experts they may just draw the map as they gather the data. The current state map is usually completed by the second day, but it needs to be refined a little the next morning. Remember, when drawing your maps, your eraser is your best friend.
Future state map
Once the current state map is complete, the team can set its sights on creating the future state map. Make sure the team members have some basic training on lean principles to develop a realistic future state map. Different authors will suggest questions to guide you to a future state. Be careful to use the questions appropriate to your type of business. Here is a short list of questions with common elements that may fit most types of business.
What is the takt time? Takt is the German word for the baton a conductor uses to control his orchestra’s speed, beat and timing. Takt time refers to how frequently a part or component must be produced to meet your customers’ demand. The formula is the time available (per shift) divided by the demand (per shift). For example:
22,000 seconds (time available)
÷ 200 pieces (demand)
= 110 seconds/piece
Are there bottlenecks or constraints? From the data collection during the kaizen, look at the cycle times or processing times. If any of these are greater than your takt time, you have a candidate for a bottleneck or constraint. This may be causing overproduction waste or work in process (WIP) in some areas or extra processing time, such as overtime, to meet demand.
Where can inventory (or queue time) be reduced or supermarkets used? Look at raw material, WIP, buffer stock, safety stock and finished goods inventories to see whether these can be reduced. Does it make sense to put in a supermarket replenishment system?
A supermarket is a controlled inventory system—the downstream process removes items from the shelf and the process owners upstream replenish that amount to the supermarket.
The key is to find ways to reduce inventory in a logical manner. Also look for opportunities for paperwork to flow and not sit around, like in batching.
Where can you improve flow? Is it possible to put materials into a cell or eliminate materials from stopping and waiting? If flow improvement isn’t possible, could a first in, first out lane be established between processes?
What other improvements are required? For instance, does the reliability of equipment need to be improved? Are the first pass yield or quality levels acceptable? Do we need to perform training in 5S (workplace organization)? Do we need to create a new layout for an area?
On the map, place a kaizen burst around any items to signal improvement is needed. Items may include low equipment reliability or first pass yield, long changeover times, large batches, any waste such as overproduction, motion, transportation, waiting, defects or adjustments, and over or extra processing. If you are not sure whether there needs to be an improvement during this timeframe, put a kaizen burst around it anyway. You can determine if it will be a priority when you put together your plan.
Draft plan
Creating (and executing) the draft plan is the most important part of VSM. Creating the maps can be an enlightening experience. But if you do not execute the plan, you have just created more muda.
During a typical VSM event, it is possible to create the draft plan based on the information from the future state map. The plan will need further refinement— especially in determining resources required, such as time, people and budgets. A good plan will include the description of the project, name of the project leader, possible team members, a schedule (or Gantt chart) of events and deliverables, an estimate of costs and the impact, goals or benefits.
Conclusion
Value Stream Mapping can be an effective tool to build improvements and efficiencies for any organization. For completing this part of the lean journey, the payoffs can be immense for any organization. VSM requires a dedicated team ready to ask difficult questions and think beyond the current state—and a team not afraid to admit error and use that e aser a few times along the way.
Interested in Interim Expert?
Discover how interim management can dramatically increase the efficiency of your business. Get in touch with our team to learn how working with GQ Interim will improve your company.
- Get started within few days
- Database of 10 000+ consultants
- Solving crucial problems of your business
- Custom solutions for your business needs
- Proven results with measurable impact
Related articles
- Strategic sourcing management turns supplier relationships into competitive advantage. Learn the 7-step process, methods, and best practices that drive margin and resilience.

- Choosing the right interim manager is not about CVs, but about matching real experience to real business challenges. Here’s how to make the right call when timing and results matter. See what criteria actually influence project outcomes and team performance.
- A balanced scorecard example demonstrates how organizations can measure more than just financial performance. Developed by Robert Kaplan and David Norton, the balanced scorecard tracks goals across finance, customers, internal processes, and learning & growth. By aligning these perspectives, it ensures that daily operations support long-term strategy and sustainable growth.

- The Theory of Constraints (TOC) is a structured approach to improving organizational performance by focusing on the single most limiting factor—the constraint. Whether it’s a production bottleneck, market demand, or a sales conversion gap, TOC answers three core questions—what to change, to what to change, and how to cause the change—and drives continuous improvement through five disciplined steps: identify, exploit, subordinate, elevate, and repeat.
