

- Why Is It Important?
- When to Use It?
- An Example of P-Diagram
What Is P-Diagram?
P-Diagram is a necessary tool for each development project. It supports better decision-making, promotes system-level thinking, and lays the foundation for robust design analysis, especially when used alongside tools like FMEA. P-Diagram is a way of compactly defining the development scope. First there are identified the signal (input) and response (output) associated with the design concept.
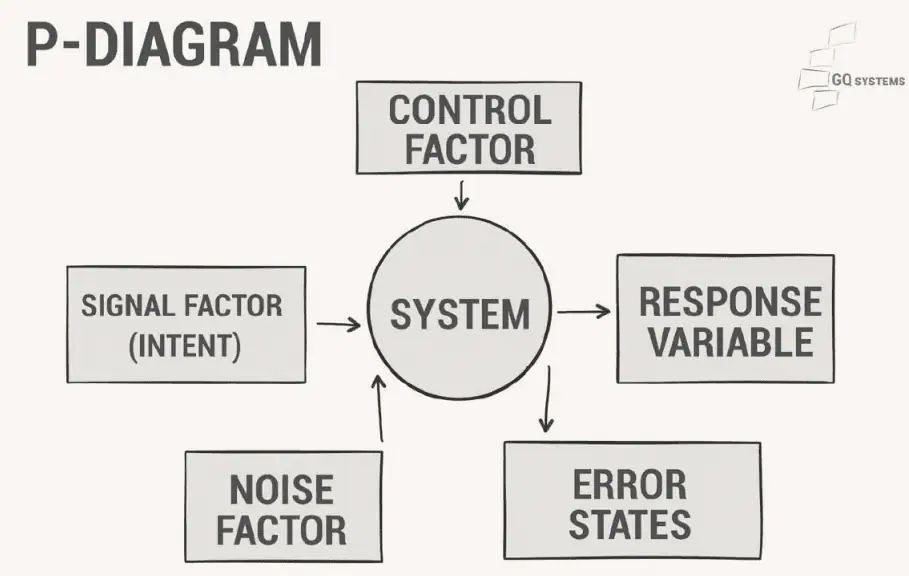
The P-Diagram, is an useful tool in brainstorming and documenting:
- Signal factors / pass through the design of product
- Response variable or Ideal function / it is an output of signal factor
- Control factors / design, materials, processes
- Noise Factors / these are not under control, environmental factors, customer usage, interfaces with other systems, degradation over time, piece to-piece variation, among others.
- Error States / the failure modes
Download our e-book
Download our free e-book to discover how GQ Interim can transform your business with expert leadership solutions!
Why Is It Important?
This diagram is based on the concept to convert 100% input signal into 100% of the ideal function. Any engineered system can possibly reach its ideal function, but for that is necessary to efficiently transform all applied energy into creating desired output energy. In reality, we do not know any system like this. Every system is less than 100% efficient in its energy transformation. This loss goes to creating unintended functions, or error states.
When to Use It?
Development of the P-Diagram should begin alongside development of the FMEA. Integrating the P-Diagram early in the design process ensures that all functional relationships, potential noise sources, and failure risks are clearly understood before critical decisions are made. It is especially valuable during concept development, system architecture planning, and risk assessment phases, where visualizing interactions between variables can guide more robust and resilient designs.
Using the P-Diagram in tandem with tools like Design FMEA and Robust Design methods enhances a team’s ability to foresee issues, document assumptions, and proactively engineer for real-world variability.
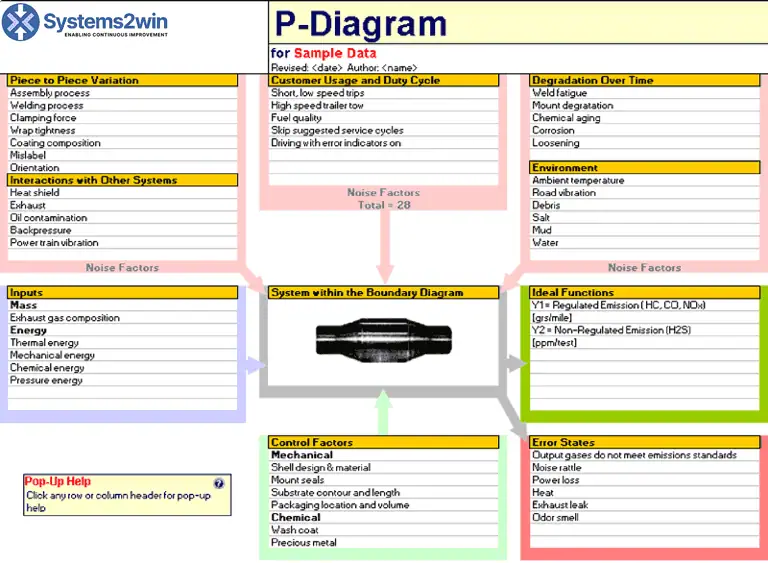
An Example of P-Diagram
Benefits of Using the P-Diagram
The P-Diagram offers several key advantages that make it a valuable tool throughout the product development cycle:
- Clarifies system behavior: By explicitly identifying input signals, ideal outputs, and external noise factors, the P-Diagram helps teams better understand how the system is expected to function under both normal and extreme conditions. This reduces ambiguity and highlights performance expectations early in development.
- Strengthens cross-functional collaboration: The visual structure of the P-Diagram makes it easy for engineering, design, quality, and manufacturing teams to communicate and align on the system’s key characteristics. It becomes a shared reference point for decision-making across departments.
- Supports robust design: When combined with methods like FMEA and Taguchi’s robust design techniques, the P-Diagram serves as a foundation for identifying potential sources of variation and implementing design strategies that minimize their impact.
- Facilitates root cause analysis: In cases where failures occur during testing or in the field, the P-Diagram helps trace the pathways between variables, making it easier to isolate the causes of performance degradation or system faults.
By offering both clarity and structure, the P-Diagram plays a critical role in designing reliable, efficient, and high-performing systems—especially in industries where quality and consistency are non-negotiable.
Conclusion
The P-Diagram plays a critical role in developing reliable, high-performance systems by capturing the full complexity of how a product operates and reacts to its environment. By systematically identifying signal inputs, ideal responses, control parameters, and noise variables, engineering teams can better anticipate failure modes and design more resilient solutions. When integrated early in the development process, the P-Diagram not only supports risk reduction and quality improvement but also aligns cross-functional teams around a shared understanding of how the system is intended to work.
Interested in Interim Expert?
Discover how interim management can dramatically increase the efficiency of your business. Get in touch with our team to learn how working with GQ Interim will improve your company.
- Get started within few days
- Database of 10 000+ consultants
- Solving crucial problems of your business
- Custom solutions for your business needs
- Proven results with measurable impact
Related articles

- A balanced scorecard example demonstrates how organizations can measure more than just financial performance. Developed by Robert Kaplan and David Norton, the balanced scorecard tracks goals across finance, customers, internal processes, and learning & growth. By aligning these perspectives, it ensures that daily operations support long-term strategy and sustainable growth.

- The Theory of Constraints (TOC) is a structured approach to improving organizational performance by focusing on the single most limiting factor—the constraint. Whether it’s a production bottleneck, market demand, or a sales conversion gap, TOC answers three core questions—what to change, to what to change, and how to cause the change—and drives continuous improvement through five disciplined steps: identify, exploit, subordinate, elevate, and repeat.

- Software quality assurance ensures that software consistently meets stakeholder needs by preventing defects and validating that products align with defined quality attributes (e.g., reliability, security, performance). Blending defect management practices with standards-based quality models like ISO/IEC 25010 helps teams plan, measure, and continuously improve quality throughout the lifecycle.

- During our jobs we meet very often with many symbols and shortcuts or abbreviations e.g. FMEA, PPAP, CC, SC etc. When I did my first internal audit at work I had to also check the implementation of CE marking. Previously I have done the research what is this CE marking to not be absolutely lost in this area. So what is it and how is itused?
