

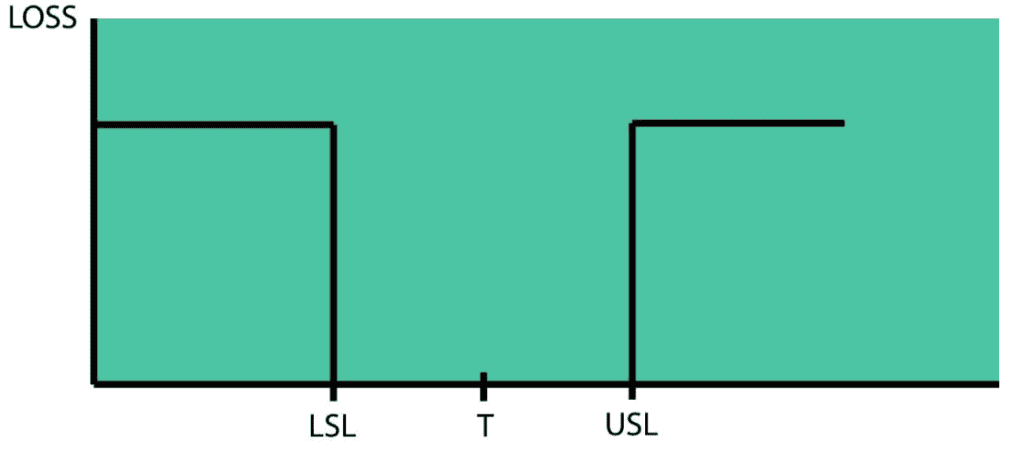
- “Good” Within Product Specifications
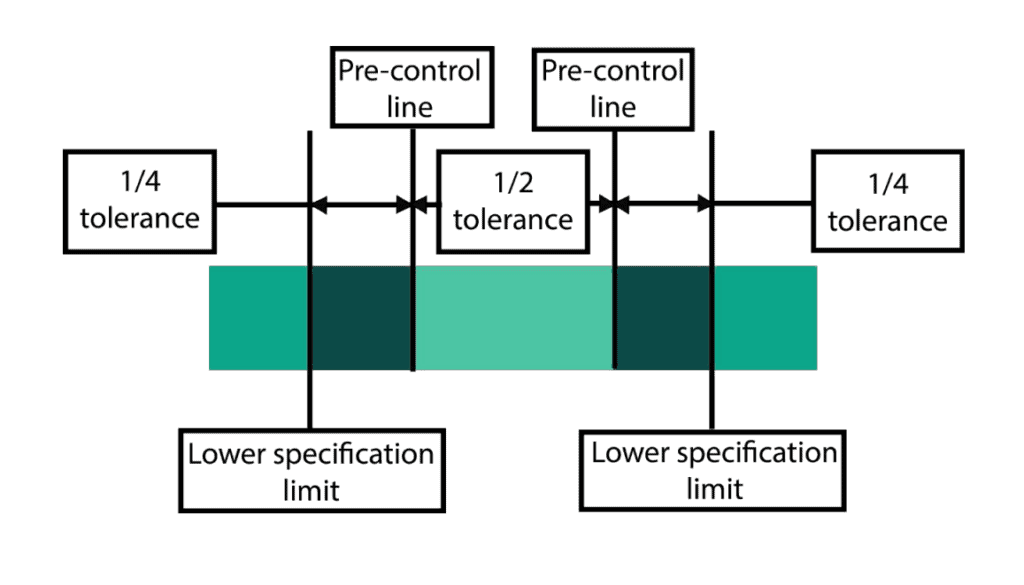
- Example of a Pre-Control Chart
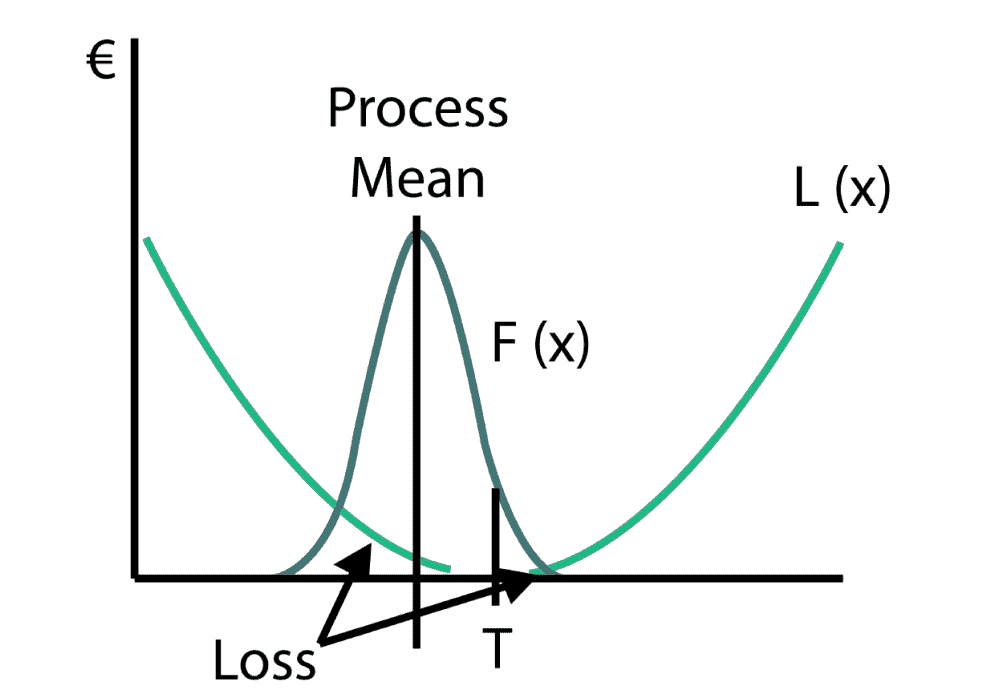
- Taguchi Loss Function
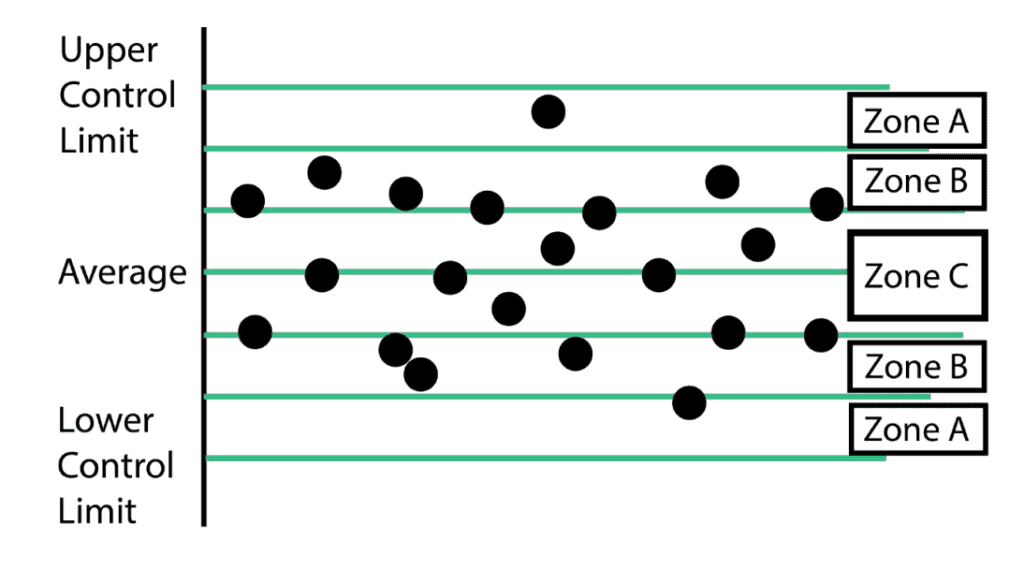
- Example of a Control Chart
Pre-Control Charts
There are 2 basic philosophical differences between those who support and those who support pre-control charts. The pre control fans keep to view any product within specification as good. All results are considered to be “good” or “bad” and the dividing line is a sharp cliff. A part that barely meets specification is as good as a part that is perfectly centered on the target (T) value. Producing product tighter than the specification limits is viewed as an unnecessary expense.
This technique targets on the voice of the customer in that the pre-control limits are based on upper and lower specification limits (USLs and LSLs). These limits are chosen such that the hard stop limit to pre-control charts are at the customer specification and cautionary limits are at ±50 percent of the specification (see Figure 2).
To set up the process capability, five subsequent units must fall between the pre-control limits in the green region. After this condition is met, two successive units are periodically sampled. If the two units fall in the green zone, continue production. If one unit falls in the green zone and the other falls in the yellow, continue production. If both units fall in the yellow zone, stop and adjust the process. If one unit falls in the red zone, stop and adjust the process. To resume normal production five units in a row must be within the green zone. The sample frequency is determined by dividing the interval between stoppages by six.
Control Charts
Control chart philosophy (Taguchi Loss Function) states that as the parameter (x) varies about the target (T) there will be a loss [L(x)] to society. Therefore, a part produced at the target is more valuable than a part produced at the specification limits. This is because throughout the value stream accommodations have to be made to be tolerant to that variation from the target value. That adds cost to subsequent steps in the value stream. (See Figure 3.)
Control limits are chosen so that time is not misspent by looking for unnecessary trouble. The practical goal is to take action only when necessary. Control limits are calculated by estimating the standard deviation of the sample data adjusted for sample size and multiplying that number by three. That number is then added to the average for the upper control limit and subtracted from the average for the lower control limit. The control chart tests are design to flag points that are not behaving “normally” (i.e., exhibiting special cause variation).
Control chart focuses on the variation that is due to the process itself. Control limits are developed from the process data and not tied to the specification limits. This is commonly referred to as voice of the process (VOP) as the process is providing information about itself.
Comparison of Control and Pre-Control Charts
Pre-control works with compliance between customer specification, the voice of the customer. Control charts are measuring process variation or VOP. Pre control charts have limited use as an improvement tool, they do not detect shifts, drifts and trends with statistical certainty as control charts or run charts do. See basic comparison between them in table below:
| Pre-Control Charts | Control Charts | |
|---|---|---|
| Protects the customer | The goal of pre-control charts | In conjunction with process capability |
| Useful in process improvement | Minimally useful | Highly useful |
| Variation inflation risk | Likely | Minimal |
| Ease of use | Must develop manually or write custom software. Charting not required. | Readily available software. Chart-based. |
| Broadly accepted | No | Yes |
| Conductive to rational subgrouping | No | Yes |
| Statistically valid | Questioned | Yes |
Conclusion
Pre-control charts are possible helpful tool when are used after changeovers. They can help to roughly center the process until there are enough values to calculate control limits and reestablish capability. For that is suggested to slightly modify the rules: “If…, stop and adjust the process” should be changed to “If …., stop and investigate the process”. By using this slightly modified pre-control charting as part of a changeover procedure the customer can be protected until stability, control and capability can be established.
Download our e-book
Download our free e-book to discover how GQ Interim can transform your business with expert leadership solutions!
Interested in Interim Expert?
Discover how interim management can dramatically increase the efficiency of your business. Get in touch with our team to learn how working with GQ Interim will improve your company.
- Get started within few days
- Database of 10 000+ consultants
- Solving crucial problems of your business
- Custom solutions for your business needs
- Proven results with measurable impact
Related articles

- A balanced scorecard example demonstrates how organizations can measure more than just financial performance. Developed by Robert Kaplan and David Norton, the balanced scorecard tracks goals across finance, customers, internal processes, and learning & growth. By aligning these perspectives, it ensures that daily operations support long-term strategy and sustainable growth.

- The Theory of Constraints (TOC) is a structured approach to improving organizational performance by focusing on the single most limiting factor—the constraint. Whether it’s a production bottleneck, market demand, or a sales conversion gap, TOC answers three core questions—what to change, to what to change, and how to cause the change—and drives continuous improvement through five disciplined steps: identify, exploit, subordinate, elevate, and repeat.

- Software quality assurance ensures that software consistently meets stakeholder needs by preventing defects and validating that products align with defined quality attributes (e.g., reliability, security, performance). Blending defect management practices with standards-based quality models like ISO/IEC 25010 helps teams plan, measure, and continuously improve quality throughout the lifecycle.

- During our jobs we meet very often with many symbols and shortcuts or abbreviations e.g. FMEA, PPAP, CC, SC etc. When I did my first internal audit at work I had to also check the implementation of CE marking. Previously I have done the research what is this CE marking to not be absolutely lost in this area. So what is it and how is itused?
